Home-Field Advantage
Is the NFL's home edge real — and is it fading?

Ask any fan, broadcaster, or bettor and you’ll hear the same thing: teams play better at home. The crowd, the travel, the familiar turf — it all supposedly adds up to a real edge. But “everybody knows it” isn’t evidence. So I went looking for the actual number.
I pulled every NFL regular-season game from 2000 to 2023 — 6,175 games — to answer two questions: is home-field advantage real, and has it changed?
This page is the story. For the full methodology — data sourcing, cleaning decisions, and how the sample was built — see the technical report →.
The short answer
Home-field advantage is real. Across all 6,175 games, home teams won 56.26% of the time and outscored visitors by an average of +2.23 points. Over six thousand games, a six-point edge on a coin flip isn’t noise — it’s a genuine pattern.
But it’s shrinking.
The edge is fading
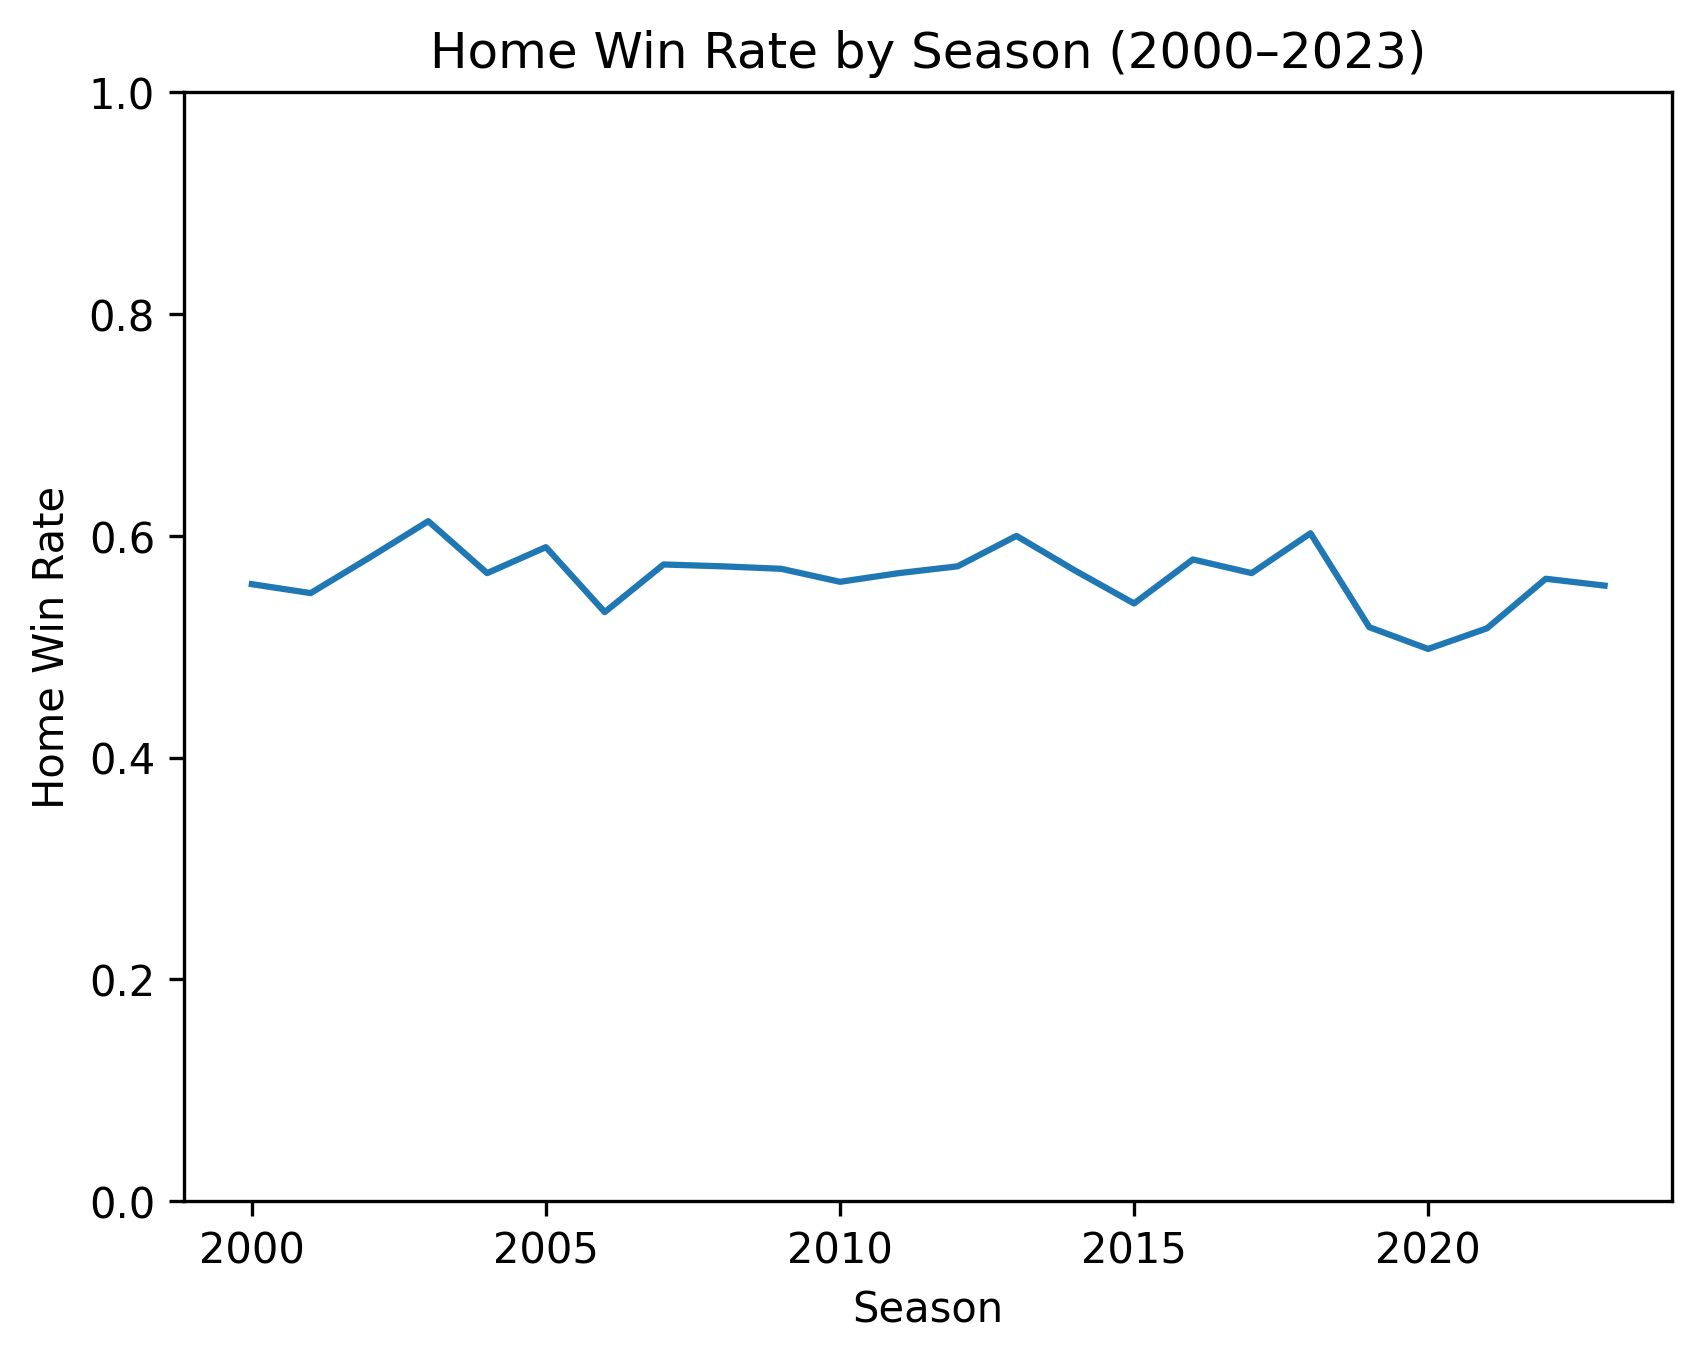
Year to year, home win rate bounces around a lot. The long-run direction is what matters, and it points down:
- 2000–2008 average: 57.03%
- 2015–2023 average: 54.84%
- The drop: 2.19 percentage points
A five-year rolling average strips out the season-to-season noise and makes the slide easier to see.
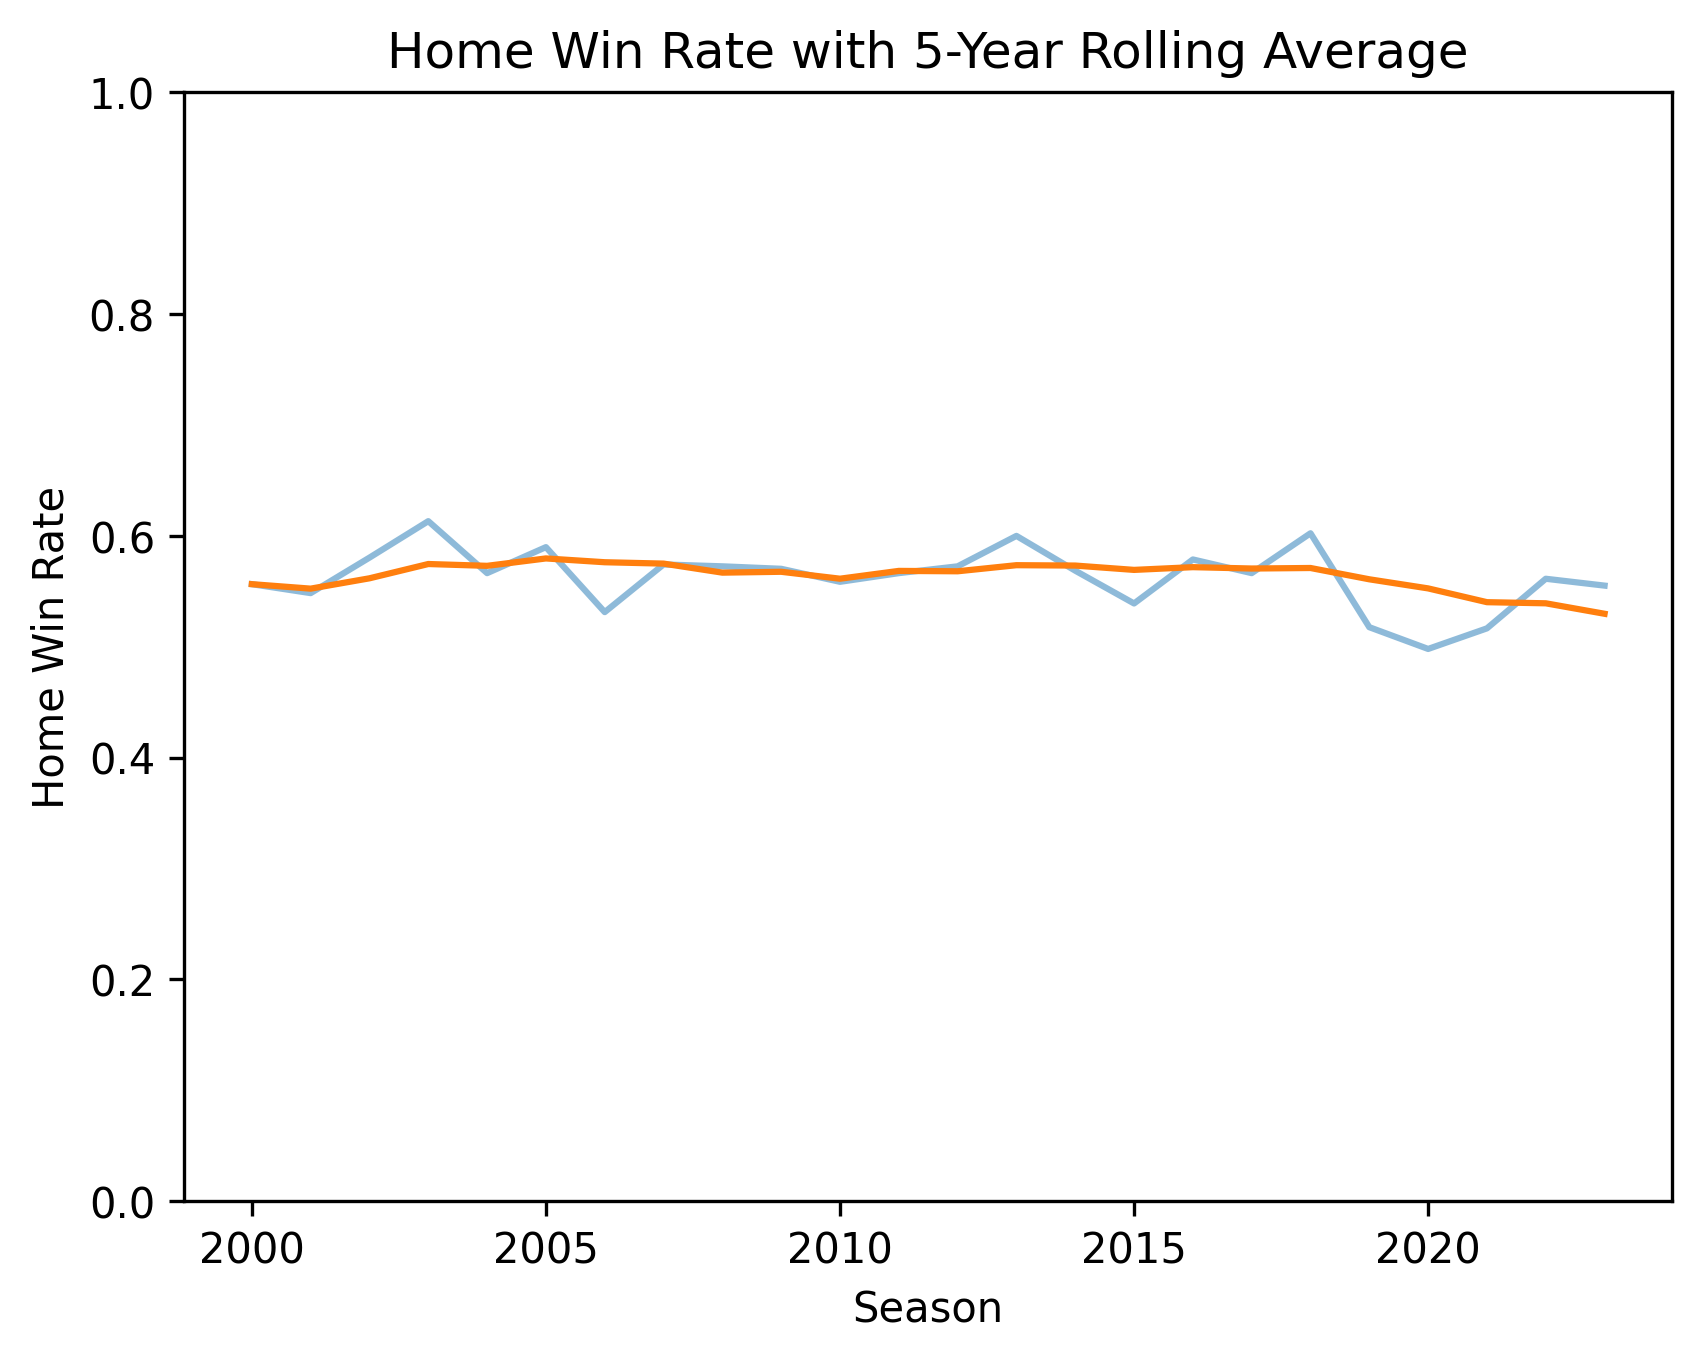
I used a five-year window on purpose: two or three years still jumps around enough to make ordinary swings look like real trend breaks, while a very long window hides genuine shifts. Five years is the middle ground — smooth enough to read the trend, sharp enough to still show a shock like 2020.
2020: the year home barely mattered
2020 is the only season in the sample where home teams didn’t win a majority — 49.80%, the lowest of the 24 years (the high was 2003 at 61.33%). Stadiums sat empty or near-empty through the pandemic, which makes crowd noise the obvious suspect. But I’m not going to overclaim it: the data shows the dip, not the reason for it. Home win rate climbs back after 2020 — it just hasn’t returned to the early-2000s norm.
It’s not just wins — it’s margin
A win is binary, so it hides how much home teams win by. The scoring margin fills that in.
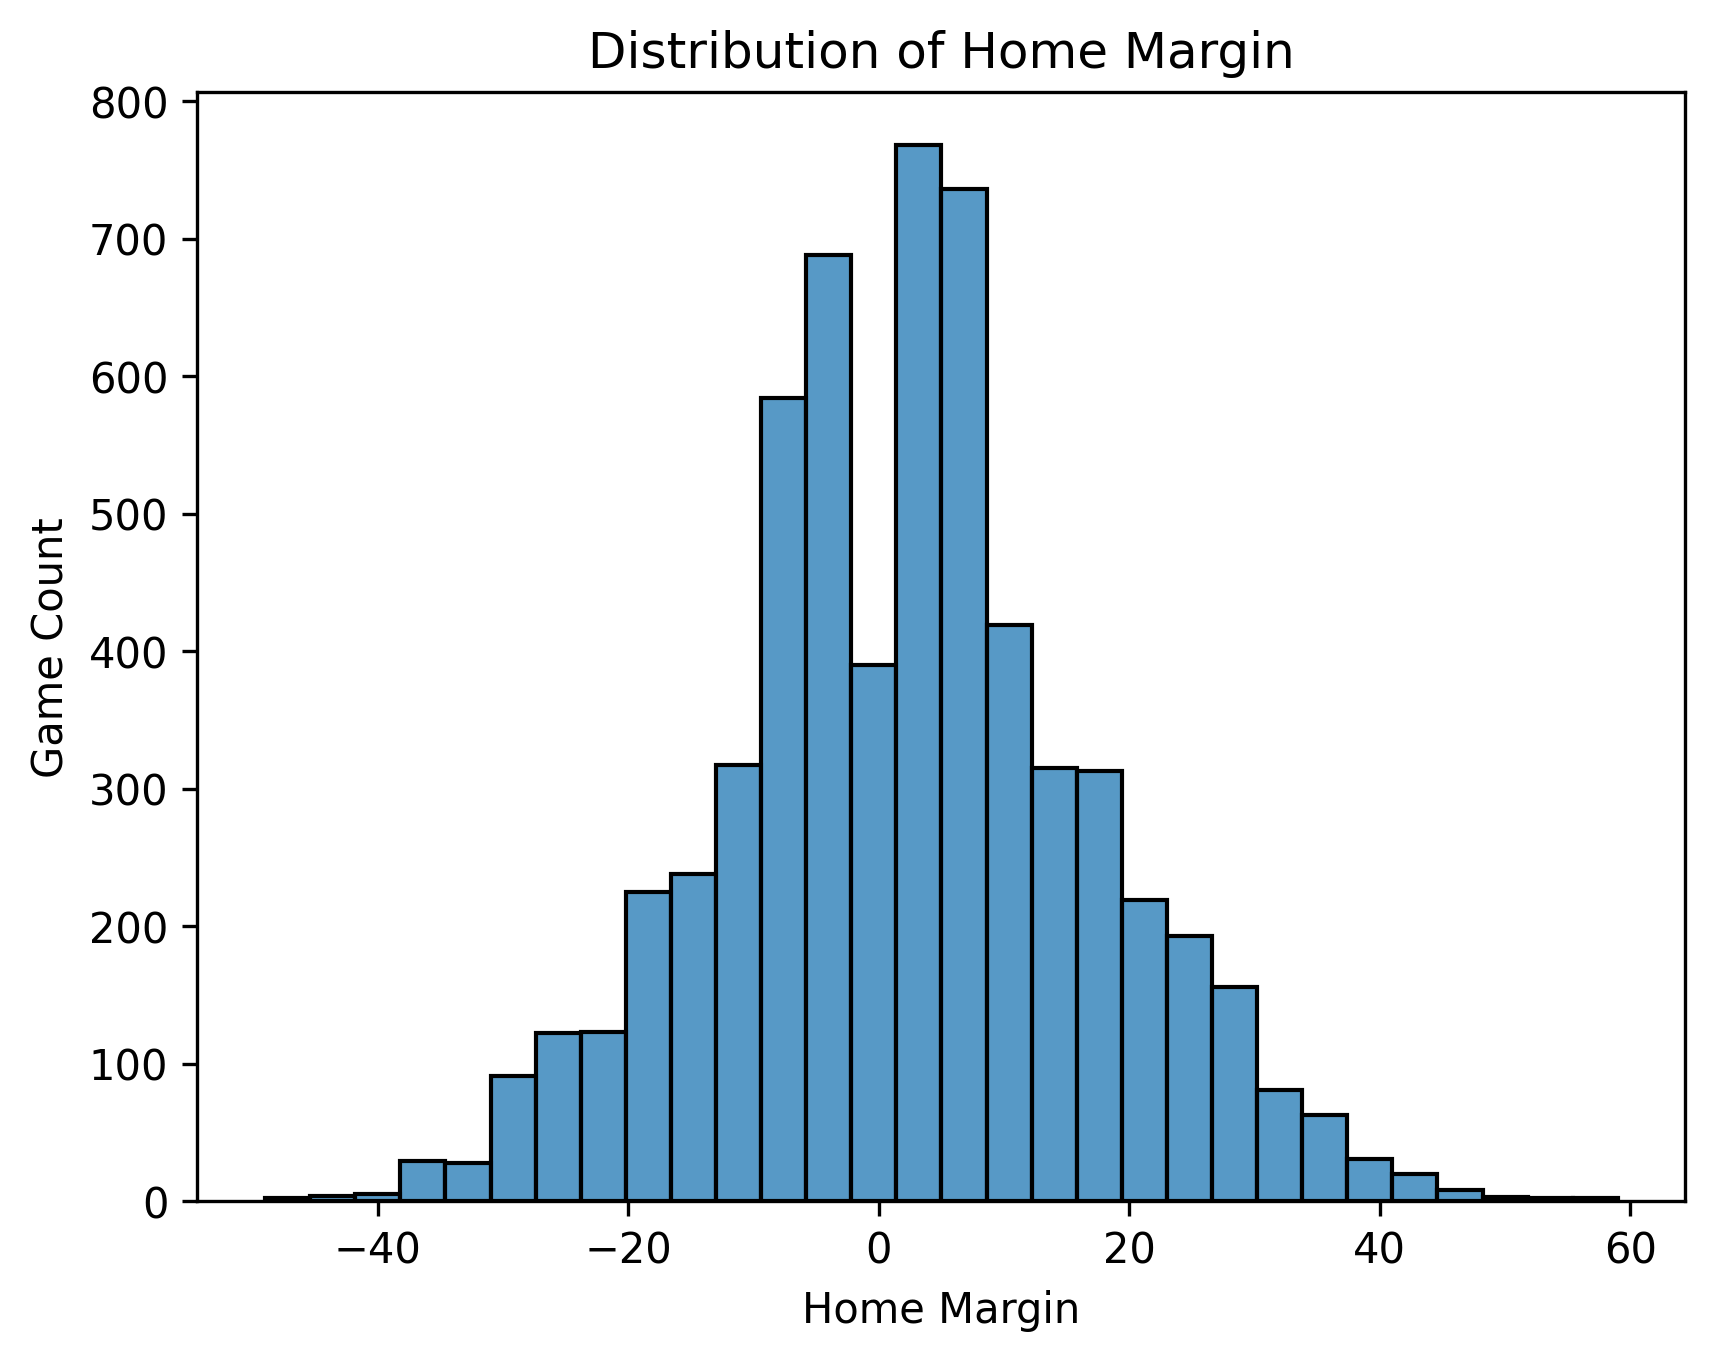
Home teams don’t only win more often — they carry a positive average margin of +2.23 points (23.17 scored to 20.94 allowed). The advantage shows up in the scoreboard, not just the win column.
What I can — and can’t — say
The honest read: home-field advantage still exists, but it’s weaker than it was twenty years ago. What the data doesn’t support is the bigger claims — that the edge is gone, that crowd noise is the sole cause, or that any of this proves causation. The dataset has no attendance, travel, injury, or team-strength controls, so it can describe the trend without explaining why it’s happening.
Why it matters
A few points of home-field edge sounds small until you multiply it across a 272-game season and a betting market that prices it in — at that scale it’s real wins and real money. The takeaway isn’t that home field is meaningless; it’s that it’s worth measurably less than it used to be, and anyone leaning on the old assumption is overpaying for it.
If I took this further, I’d add attendance data to test the crowd-noise idea head-on, separate out neutral-site and international games, and bring in team-strength controls to start moving from what happened toward why.
Full data sourcing, cleaning, and methodology: Home-Field Advantage — Technical Report →