Home-Field Advantage in the NFL (2000-2023)
Course: DTSC-2301 Data Science Foundations (UNC Charlotte)
Tools: Python, pandas, matplotlib, seaborn
Dataset: nflverse game-level data (games.csv)
Why this project matters
People often say NFL teams play better at home. We hear this all the time from fans, TV analysts, and betting discussions. But instead of assuming it is always true, I wanted to check the data.
This project looks at two things:
- Does home-field advantage show up in the data?
- Has that advantage changed over time?
1) Problem definition
Research question
To what extent does home-field advantage influence NFL game outcomes, and how has that effect changed from 2000-2023?
Project goal
This is an exploratory project. I am trying to understand patterns in past data, not build a prediction model.
Why someone might care
- Fans who want to understand if “home-field advantage” is real
- Students learning how to connect data cleaning to good analysis
- Anyone who wants a data-based answer instead of just opinions
2) Data description and sample design
Data source
- nflverse
games.csv - https://github.com/nflverse/nfldata/raw/master/data/games.csv
What each row means
Each row is one NFL game.
Main columns used
seasongame_typehome_scoreaway_scoregame_id
Other indicators that were available but not used in final analysis
The dataset also includes other fields such as overtime (overtime) and additional game context columns. I reviewed these, but I did not include them in the final analysis because they are outside this project’s scope.
This project focuses on one core question: how home win rate changed over time. Adding many extra indicators at once would make the story less clear for this assignment.
Sample size and filtering steps
- Raw file: 7,276 games (1999-2025)
- Keep only 2000-2023: 6,447 games
- Keep regular season only: 6,175 games
- Seasons in final sample: 24
- Average games per season: 257.3 (range 248-272)
- Ties: 14 games (0.23%)
What this data does not include directly
This dataset does not directly include some things that could matter, like:
- detailed travel burden,
- crowd size and noise,
- injuries,
- or full team strength controls.
So we can describe patterns, but we should be careful about saying exactly why those patterns happen.
3) Cleaning and preparation decisions
Decision A: Use 2000-2023
Why: It gives enough years to study trends, while still focusing on the modern NFL.
Tradeoff: We leave out older seasons and newer seasons after 2023.
Decision B: Focus on regular-season games
Why: Regular-season data is more consistent year to year, which helps trend comparisons.
Important note: playoff rows in this dataset are labeled WC, DIV, CON, and SB (not POST). Because of this, the current postseason export logic produced an empty postseason file. To keep results reliable, I focused final claims on the regular-season sample.
Decision C: Make score columns numeric and check for missing values
- Converted
home_scoreandaway_scoreto numeric - Removed rows missing either score
Why: This makes sure win/loss calculations are valid.
Result: No regular-season rows were removed, but this check is still important.
Decision D: Handle ties separately
home_win = 1for home winhome_win = 0for home losshome_win = NaNfor ties- Also created a separate
home_tiecolumn
Why: Ties should not be counted as losses.
Decision E: Check for duplicate games
I verified that game_id values are unique in the final sample.
4) Visual analysis
Visual 1: Home win rate by season
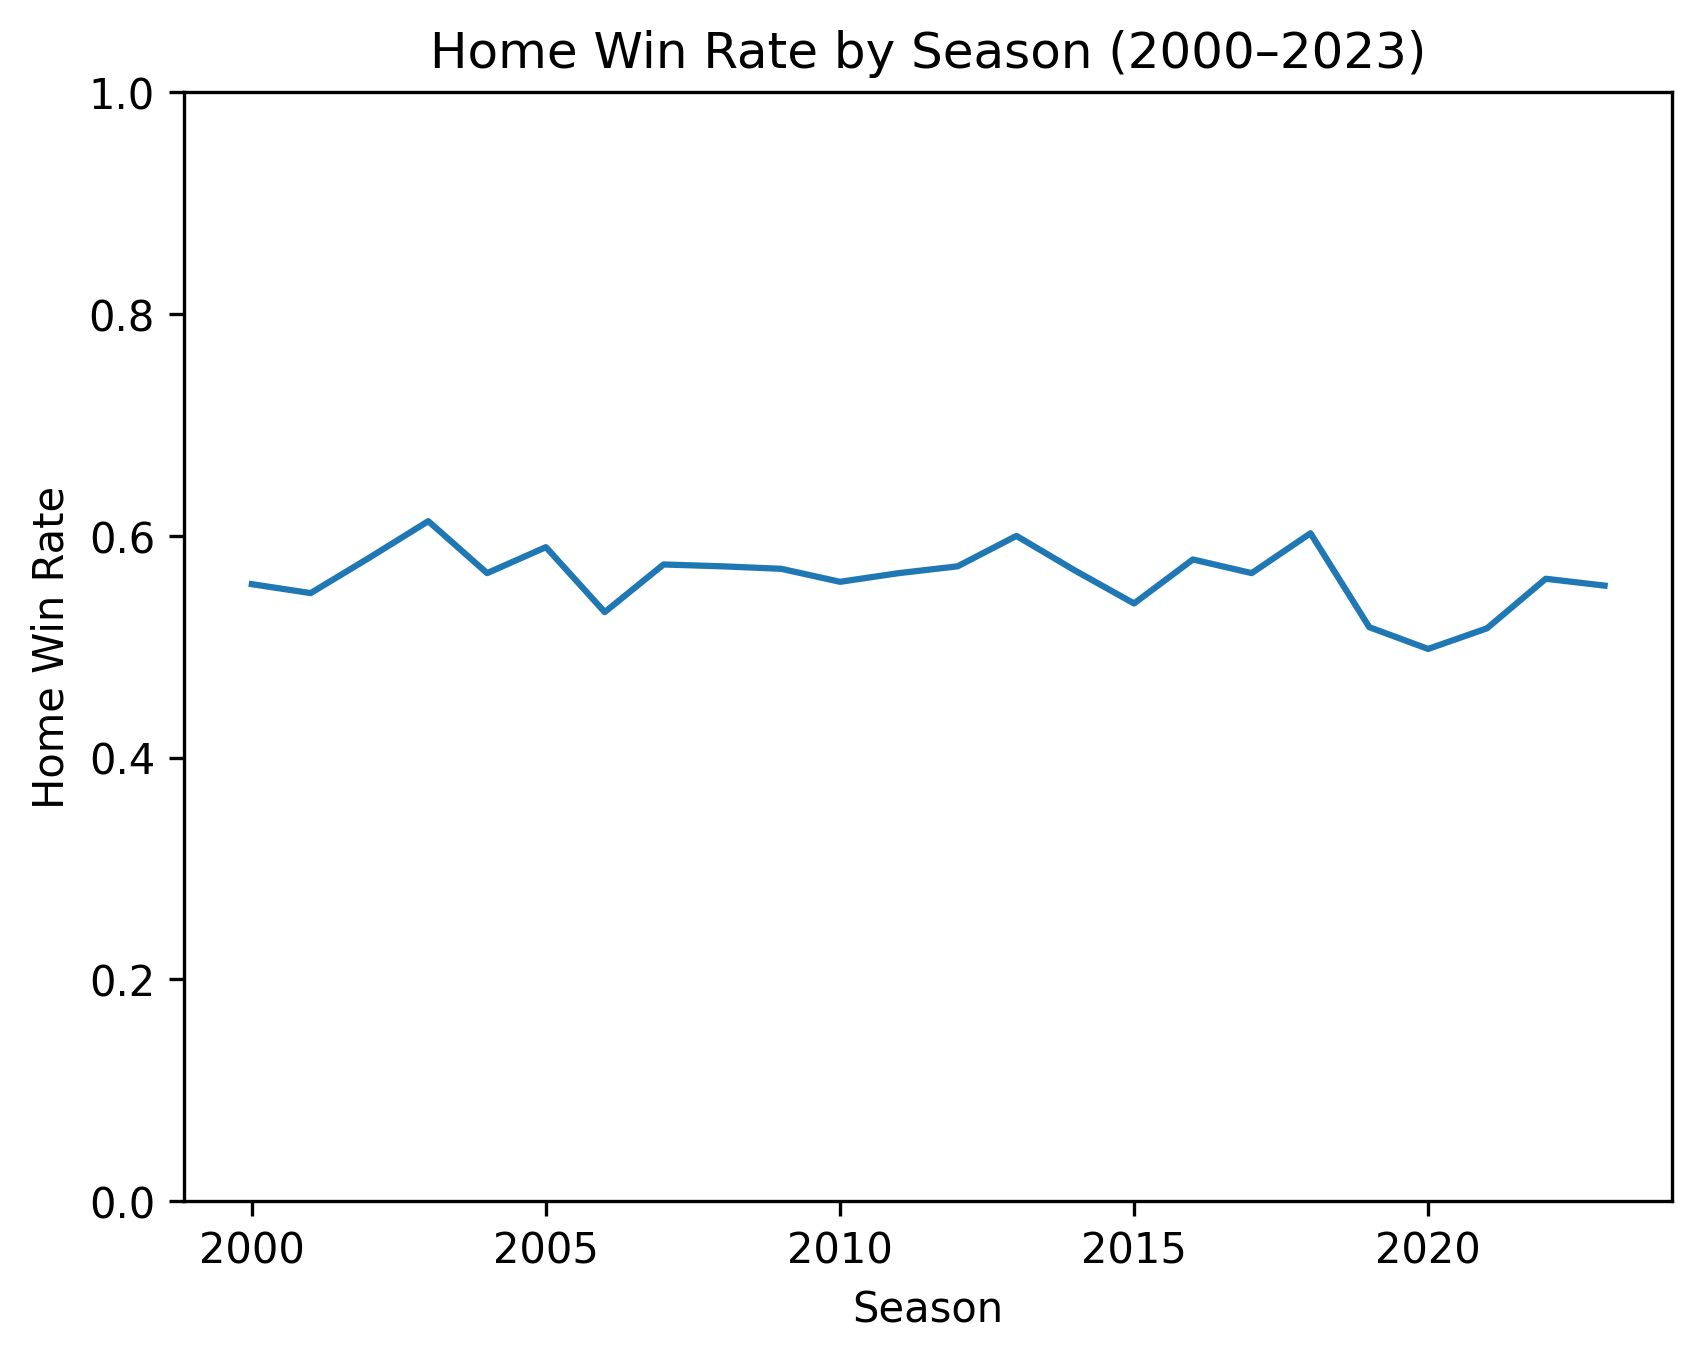
Why this chart: It shows how home win rate changes year by year.
What it shows:
- Home teams are usually above 50%, so home advantage exists.
- There is a lot of season-to-season movement.
- 2020 looks unusually low.
Visual 2: Home win rate with 5-year rolling average
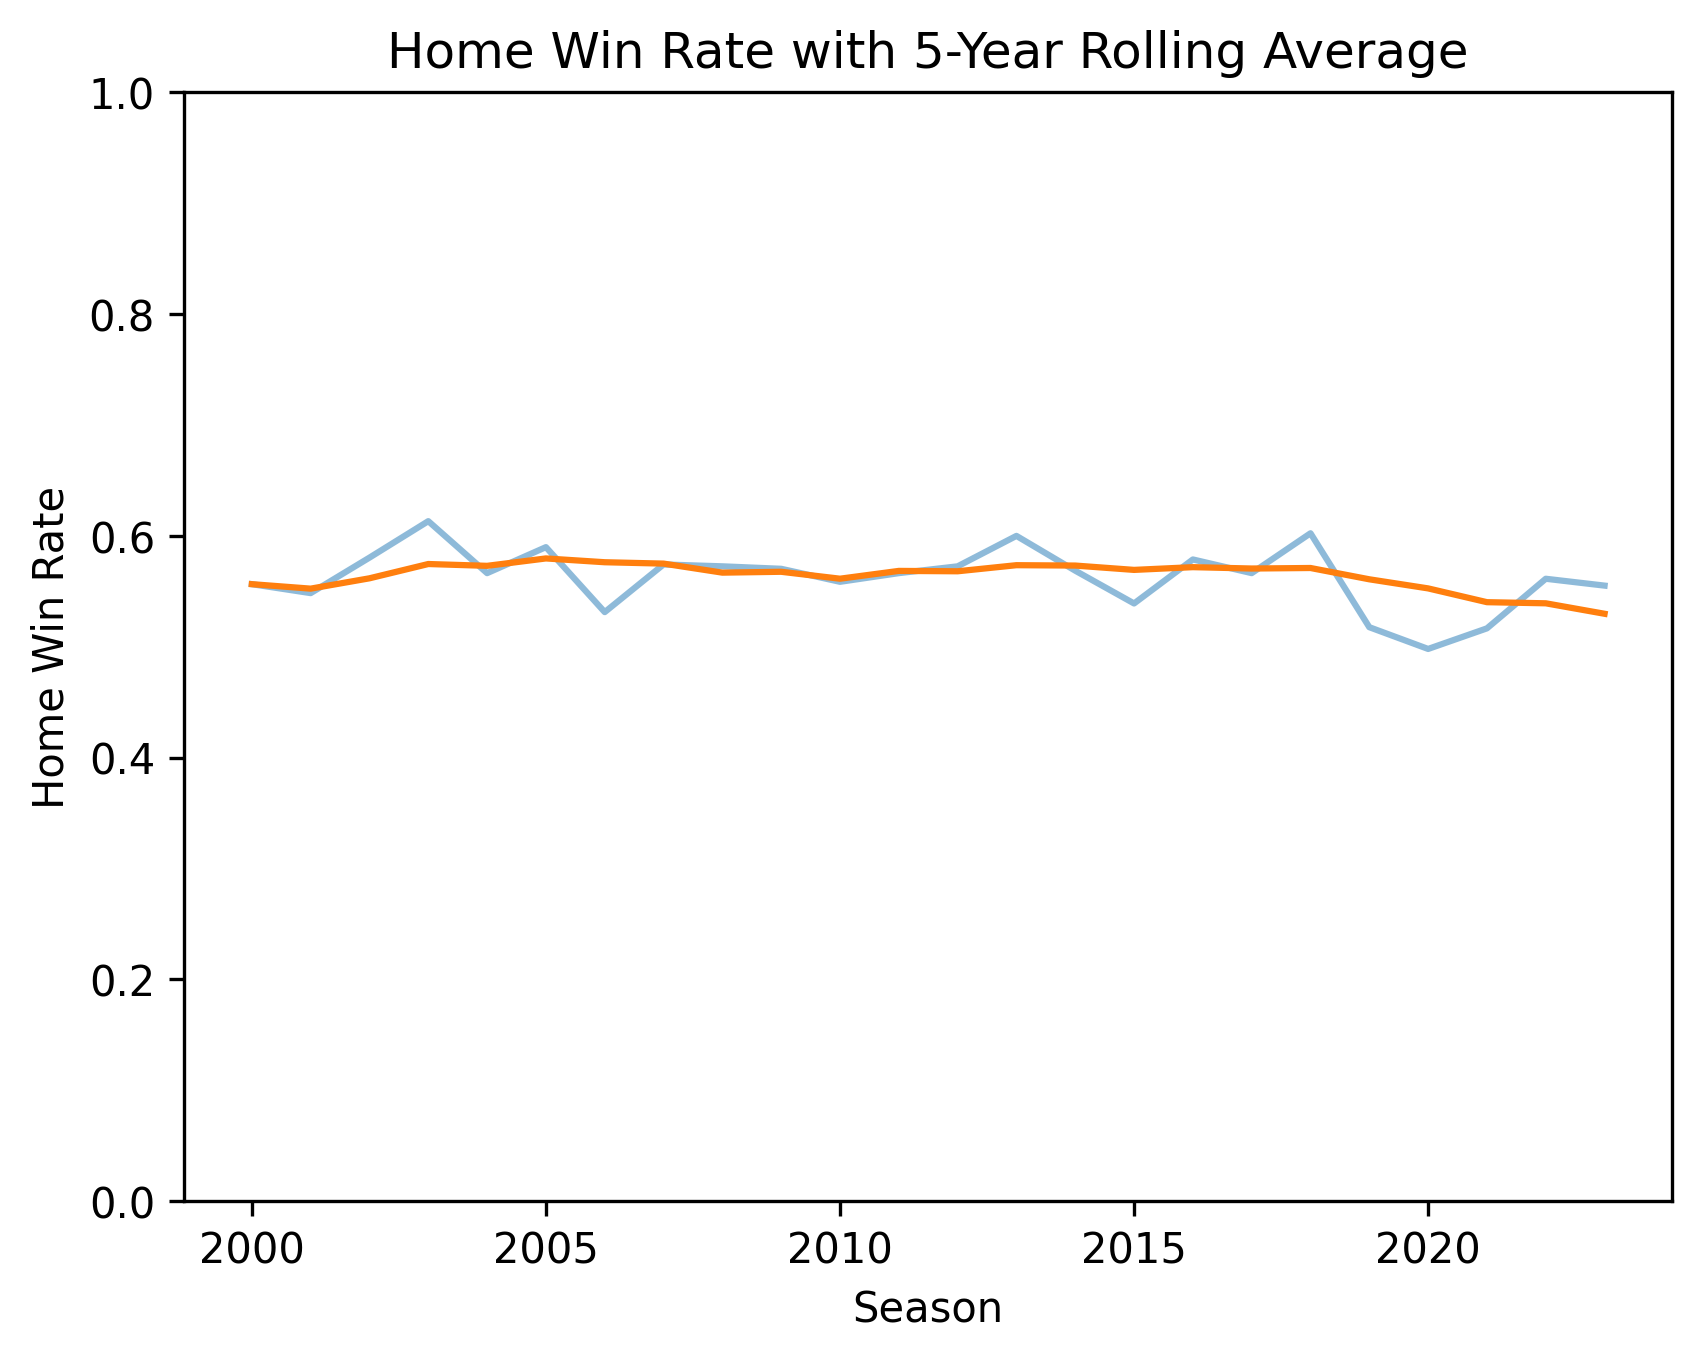
Why this chart: It makes the long-term trend easier to see.
Why 5-year instead of 2- or 3-year: A 2-year or 3-year average still jumps around a lot and can make normal ups and downs look like major trend changes. A 5-year average smooths short-term noise so the long-term direction is easier to read.
I also did not use a very long window because that can hide important shifts. So 5 years is a good middle option: smooth enough to see the big pattern, but still able to show major changes like 2020.
Visual 3: Home scoring margin distribution
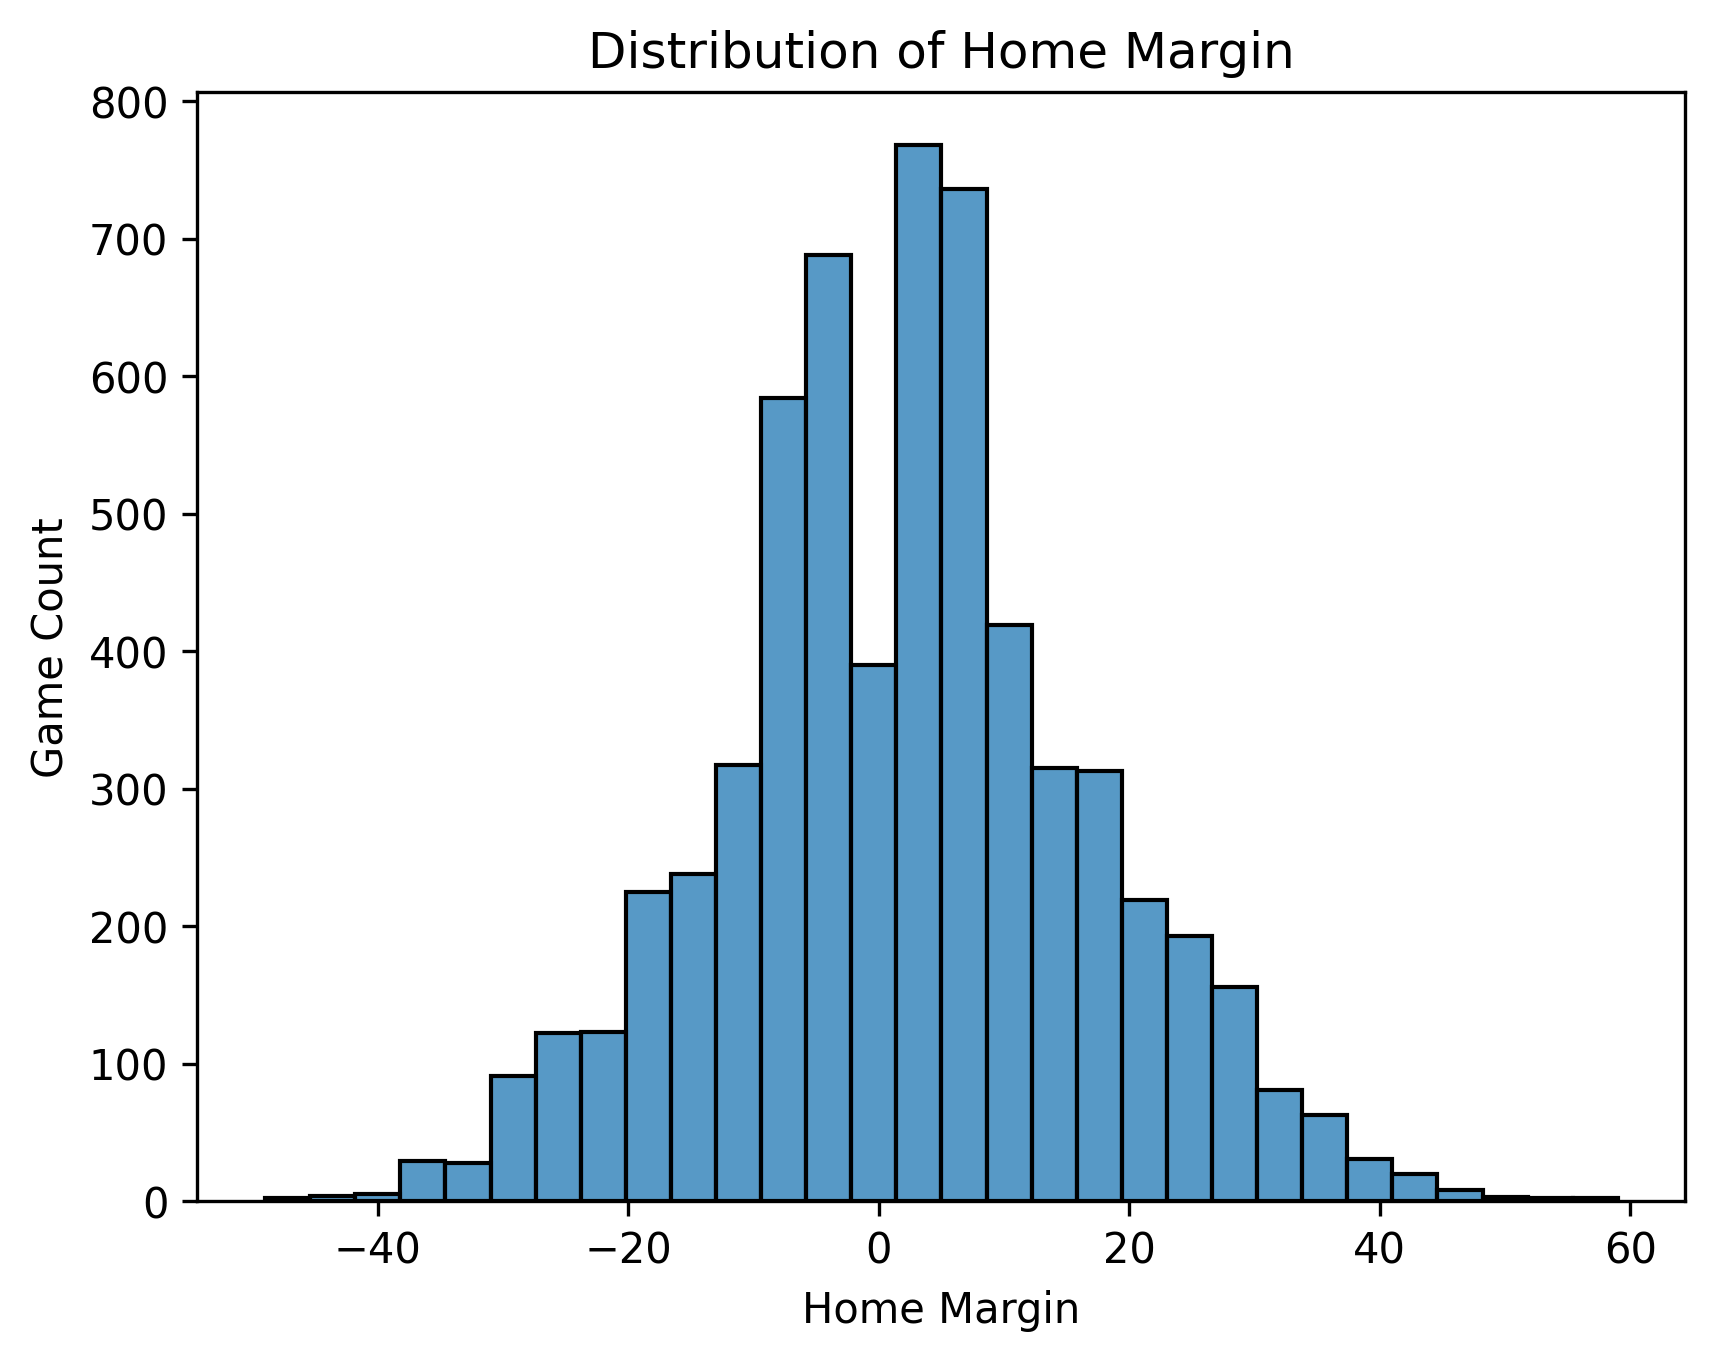
Why this chart: Win rate is only yes/no. Margin adds more detail about game outcomes.
What it shows:
- Home teams do not just win a bit more often.
- They also have a positive average point margin.
5) Main findings
Finding 1: Home-field advantage is real
Across 6,175 regular-season games, home teams won 56.26% of games.
Finding 2: Home advantage looks weaker than in the early 2000s
- 2000-2008 average home win rate: 57.03%
- 2015-2023 average home win rate: 54.84%
- Change: -2.19 percentage points
Finding 3: 2020 is the lowest season in this sample
- Lowest season: 2020 at 49.80%
- Highest season: 2003 at 61.33%
Finding 4: There is some rebound after 2020
Home win rate rises after 2020, but still appears lower than many early-2000s years.
Margin context
- Mean home score: 23.17
- Mean away score: 20.94
- Mean home margin: +2.23 points
6) Interpretation
The best conclusion is:
- Home-field advantage still exists,
- but it appears weaker than it was in earlier years.
This project describes patterns in the data. It does not prove a single cause.
7) What would be misleading to say
It would be misleading to claim:
- home-field advantage is gone,
- crowd noise is the only cause,
- or this project proves causation.
The data supports trends, not final cause-and-effect proof.
8) Limitations, assumptions, and reflection
Main limitations
- No full controls for team quality, QB quality, injuries, or coaching
- No direct attendance/crowd variable
- Neutral/international game context not modeled separately
Assumptions
game_idcorrectly identifies unique games- Score columns are valid after cleaning
- Seasonal averages are appropriate for this question
Reflection
A small percentage change can still matter across thousands of games. At the same time, careful analysis means being honest about what the data can and cannot tell us.
9) Next steps (if I continue this project)
- Add attendance data to test crowd-related ideas more directly
- Separate neutral-site/international games
- Add more controls for team strength
- Compare more time periods in a formal way
10) References and transparency
Data source
- nflverse. nfldata: games.csv (GitHub repository dataset file). Retrieved February 18, 2026, from https://github.com/nflverse/nfldata/raw/master/data/games.csv
Transparency
- ChatGPT 5.2 was used as a support tool to polish written explanations for clarity and readability and as a teaching aid during web development (e.g., explaining concepts, troubleshooting, and improving understanding). It was not used to design, generate, or compose the core analytical, technical, or conceptual components of this project. All primary ideas, decisions, and project outcomes remain the author’s own.
View full code
GitHub Repository:
DTSC-2301-Project-1