Predicting the Madness
Can a Machine Actually Predict March Madness?
Every March, 68 college basketball teams enter a tournament and millions of people fill out brackets convinced they’ve figured it out. Most of them haven’t. Even the most informed fans rarely get more than 60% of games right.
So I decided to ask a different question: what does the data actually say about who wins — and can a machine learning model do better than conventional wisdom?
The Data
I pulled historical NCAA tournament and regular season data going back to 2003 — over 120,000 games worth of box scores, seeds, and outcomes from the Kaggle March Machine Learning Mania competition. The dataset includes every Division I regular season game and every tournament game since 2003, along with third-party rankings like KenPom.
What the Data Actually Shows
Before touching any model, the numbers tell an interesting story.
Seeds matter — but not as much as you’d think.
1-seeds win about 85% of their first-round games. But by the Sweet 16, the gap narrows fast. A 5-seed and a 3-seed have played nearly the same number of tournament games historically. The chart below (from the notebook EDA) shows win rate by seed across all tournament rounds since 2003 — notice how quickly the advantage flattens out past seed 4.
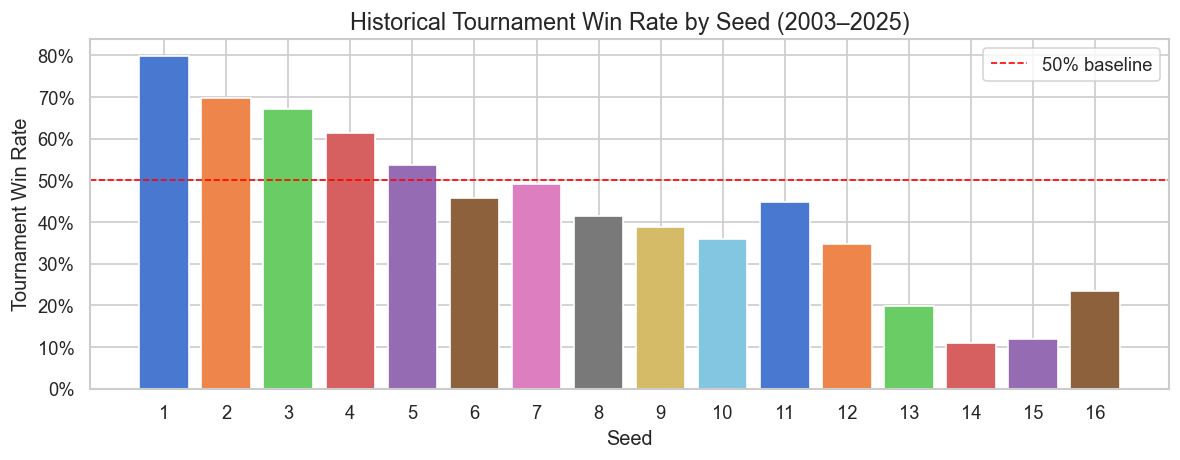
Games are close. Nearly 29% of all tournament games since 2003 were decided by 5 points or fewer. The average winning margin is only 12 points. That means a lot of outcomes come down to a few possessions — which no model can reliably predict.
How I Built the Model
Rather than feeding raw stats into a model, I engineered features that measure relative team strength — how much better or worse is Team A compared to Team B on each dimension? This includes:
- Net efficiency — the gap between points scored and allowed per possession
- Effective field goal percentage — accounts for the extra value of 3-pointers
- Turnover rate — teams that take care of the ball consistently go further
- Offensive rebound rate — second-chance points matter in close games
- Strength of schedule — beating bad teams all year isn’t the same as competing in a tough conference
- Seed difference — still a strong signal, since it reflects expert judgment from the selection committee
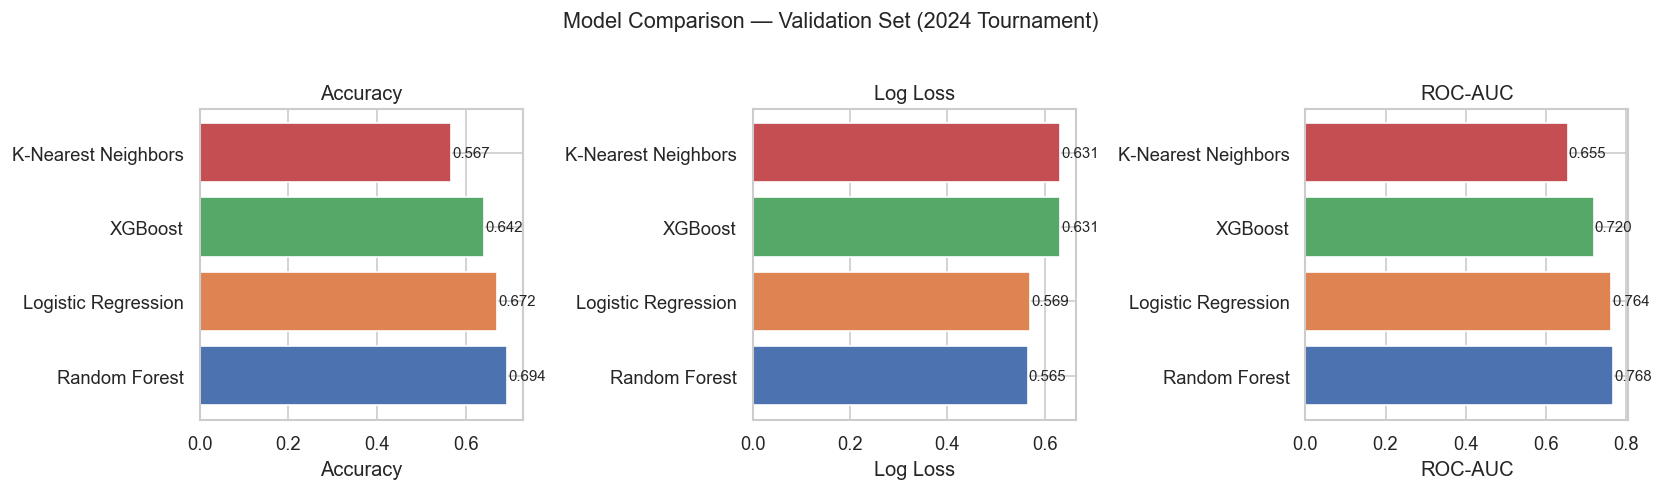
I tested four models: Logistic Regression, K-Nearest Neighbors, Random Forest, and XGBoost, then compared them on accuracy, log loss, and ROC-AUC.
How Well Does It Work?
Short answer: better than chance, but not perfect.
| Model | Accuracy (2025 Tournament) | ROC-AUC |
|---|---|---|
| Logistic Regression | 76.1% | 0.869 |
| K-Nearest Neighbors | 85.1% | 0.881 |
| Random Forest | 73.9% | 0.883 |
| XGBoost | 75.4% | 0.848 |
On the 2025 tournament — data the model had never seen — all four models beat the 50% coin-flip baseline by a wide margin. The Random Forest was selected as the best performer based on log loss, which measures not just whether the model picked the right winner but how confident it was.
The model is good at picking expected winners. It’s not good at picking 12-over-5 upsets — and neither is anyone else.
What Actually Wins in March?
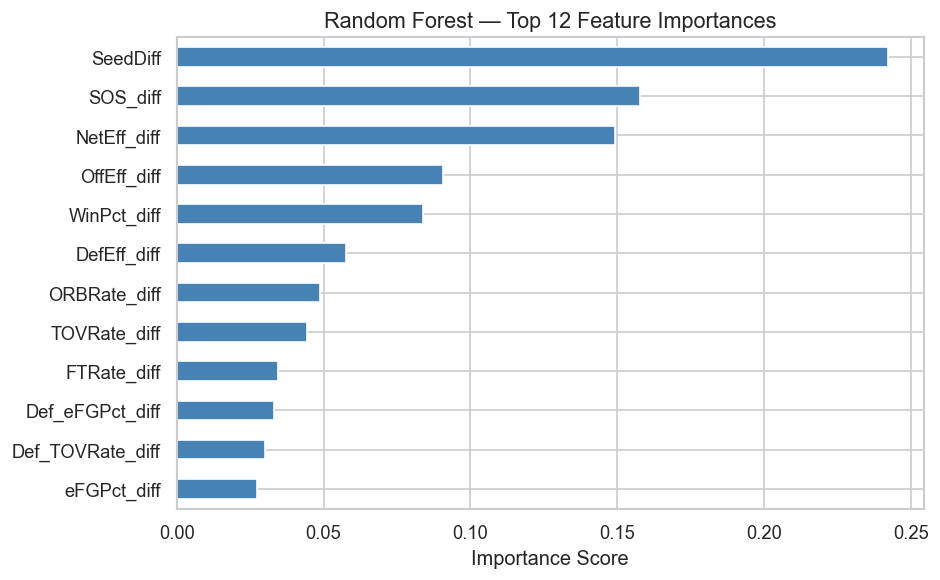
According to the feature importance analysis, the factors that matter most are:
- Seed difference — by far the strongest predictor. The selection committee’s judgment about team quality is hard to beat.
- Strength of schedule — teams that earned their record against tough competition hold up better in March
- Net efficiency — the gap between points scored and allowed per possession; the best efficiency-based predictor
- Offensive efficiency — scoring efficiently matters more than scoring a lot
What matters less than people think: free throw rate and defensive rebounding in isolation. It’s the combination of seed, schedule strength, and efficient play that separates tournament teams.
Why This Matters
This isn’t just about basketball brackets. The same framework — using relative performance metrics to predict head-to-head outcomes — applies broadly in sports analytics, business competition modeling, and any domain where two entities compete on measurable dimensions. The result shows that efficiency-based metrics consistently outperform simple win-loss records as predictors, which has real implications for how teams are evaluated and seeded.
For March Madness specifically: the model confirms that seed is meaningful but not deterministic. Roughly 1 in 3 games is genuinely a toss-up based on the numbers. That’s not a flaw in the model — that’s March Madness.
How Did the Model Actually Do in 2026?
Across the full 2026 tournament — 59 main bracket games the model had never seen — the Random Forest correctly predicted 46 of 59 matchups (78.0%).
| Round | Correct | Total | Accuracy |
|---|---|---|---|
| Round of 64 | 23 | 28 | 82% |
| Round of 32 | 12 | 16 | 75% |
| Sweet 16 | 5 | 8 | 62% |
| Elite Eight | 3 | 4 | 75% |
| Final Four | 2 | 2 | 100% |
| Championship | 1 | 1 | 100% |
| Total | 46 | 59 | 78.0% |
The model was sharpest in the first round, where seed gaps are largest and favorites almost always win. It got shakier in the Sweet 16 — exactly where the bracket gets genuinely unpredictable — then finished strong, correctly predicting both Final Four games and the championship. Michigan defeated UConn 69–63 to win the 2026 national title, and the model had Michigan winning it all.
References & AI Transparency
Data source: Kaggle — March Machine Learning Mania 2026
Libraries used: pandas, numpy, scikit-learn, XGBoost, matplotlib, seaborn
AI tools used: Claude (Anthropic) was used to help structure and debug the notebook and assist with feature engineering. All analysis, interpretation, and writing reflect my own understanding and decisions.
Full code: github.com/HPAuncc/March-Madness-Model